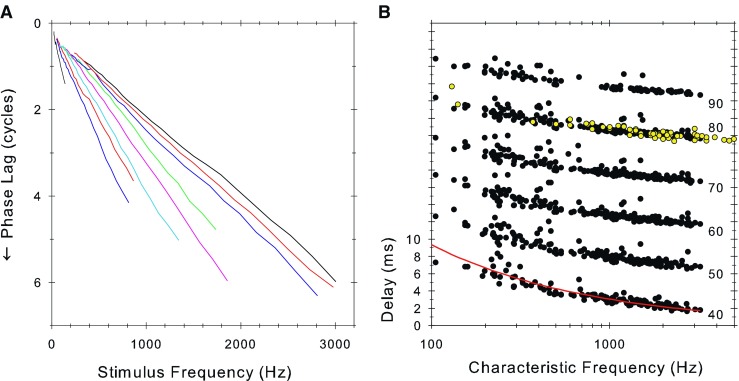
FIG. 7.

A Raw phase lag versus stimulus frequency curves for nine fibers at the highest sound level presented (approximately 90 dB SPL). B Delay to the recording site computed as the slope of the raw phase-frequency plots (as in A), plotted as a function of fiber characteristic frequency and sound level (in dB SPL as shown to the right). The y-axis is correct for the 40-dB SPL data and each subsequent plot is displaced by 5 ms for clarity. The open symbols are from a previous study in guinea pig (Palmer and Russell 1986). The solid line is the equation 87.56 × CF(Hz)−0.486 described in Figure 7 of Siegel et al. (2005).
