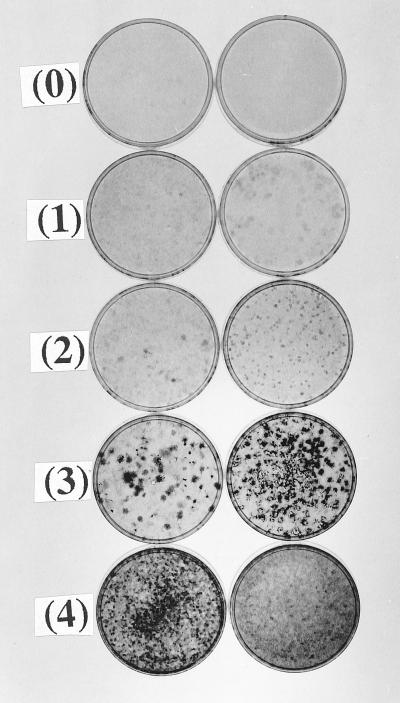
Figure 4.
Scale used in classifying the degrees of transformation. Starting from the top of each of the two columns: Nontransformed, degree 0; very weakly transformed, degree 1; weakly transformed, degree 2; moderately transformed, degree 3; strongly transformed, degree 4. In degrees 1–4, the two cultures indicate the lower (Left) and upper bounds (Right) of transformation of the category. The two negatives of category 0 were from the first 1° assay of the SA′ clones and the others from the 3° assay of the second series.

