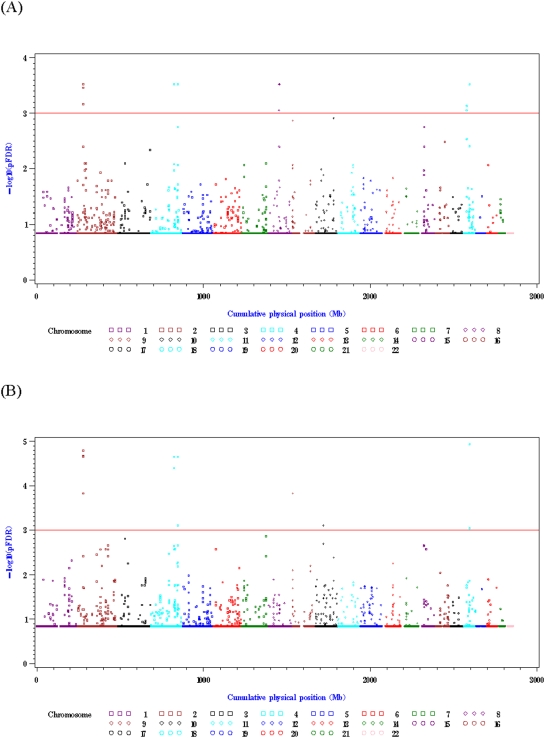
Figure 1. Results of genome-wide p-value combination analysis using p values from CLR-NOMINAL or CLR-ORDINAL analyses.
The y axis denotes −log10(pFDR), and the x axis denotes cumulative physical positions on autosomes. The red reference line signifies −log10(pFDR) = 3. (A) Results of p-value combination tests based on p-values from a CLR-NOMINAL analysis; (B) Results of p-value combination tests based on p-values from a CLR-ORDINAL analysis.

