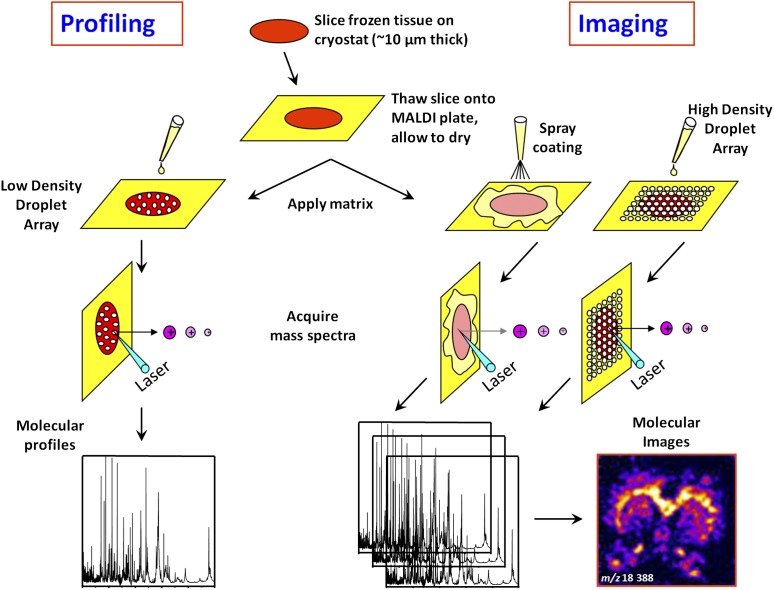
Figure 3.
Scheme outlining the different steps involved in profiling and imaging mass spectrometry of tissue samples. Sections are cut (∼10 μm thick) from fresh frozen biopsies and mounted on a conductive target plate. In the “Profiling” experiment, droplets of matrix are deposited on the sections at discrete locations of interest defined by histology. Protein profiles are then acquired. In the “Imaging” experiment, matrix is deposited in a homogeneous manner on the sections (spray or droplet array deposition), minimizing analyte delocalization. The entire surface of the sections is then systematically analyzed by moving the sample with a fixed step (ranging between 50 and 300 μm) defining the imaging resolution. At each grid coordinate, a protein profile is acquired. Protein expression maps (or images) can be reconstructed for every m/z value detected by integrating the corresponding signal intensities and plotting these as a function of sampling coordinates.

