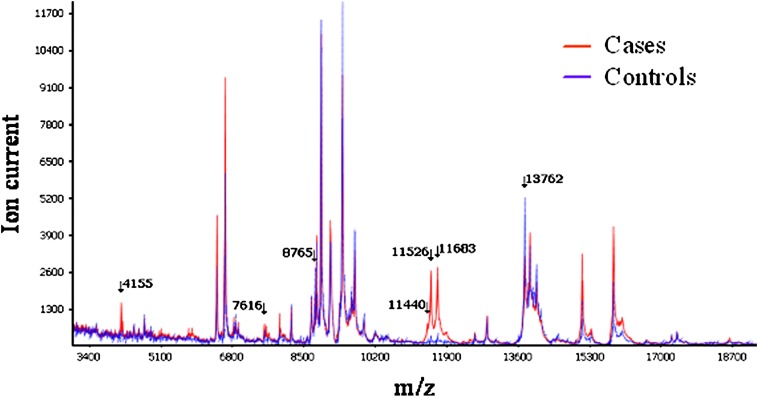
Figure 4.
MALDI MS serum spectra from individuals with lung cancer and matched control subjects. Average intensity of spectrum analysis between matched cases (red line) and controls (blue line) are presented. Arrows point to m/z values of discriminatory features. Reprinted by permission from Reference 132.

