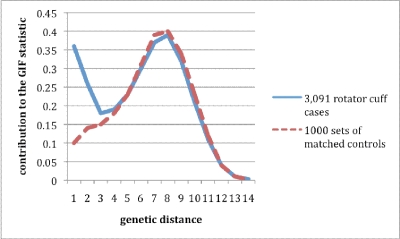
Fig. 1.
Comparison of the distributions of relatedness measure from pairwise relationships for 3091 patients with rotator cuff disease and the average distribution of relatedness measure from pairwise relationships for 1000 sets of matched controls. The lines plotted represent the contribution to the overall relatedness measure of the Genealogical Index of Familiality (GIF) statistic (shown on the Y axis) for each pairwise genetic distance (X axis) for pairs of patients and for pairs of controls. Genetic distance (X axis) refers to different types of pairwise relationships, increasing from close relationships (1 = parent-offspring and 2 = siblings or grandparent-grandchild) to more distant relationships (6 = second cousins and 8 = third cousins).

