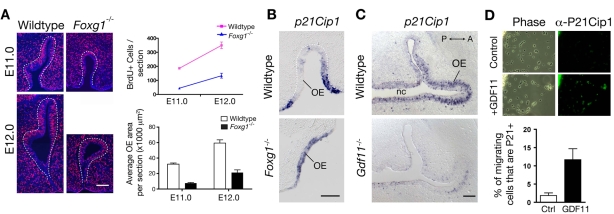
Fig. 3.
Cell proliferation and p21Cip1 expression in mutant and wild-type OE. (A) BrdU pulse-fix experiments were performed as described in the Materials and methods, with pregnant dams injected at gestational day 11 or 12. Images show representative anti-BrdU immunostaining results. Graph shows quantification (mean±s.e.m.) of total number of BrdU+ cells per OE section at each age in Foxg1-/- embryos (blue) and wild-type littermates (pink). Histogram shows average OE area per section for mutants versus wild types. The number of BrdU+ cells is significantly lower in Foxg1-/- mutants at each age, as is the average area of OE per section (P<0.01, Student's t-test). Data were collected from two animals of each genotype at each age. (B) Coronal sections of an E10.5 Foxg1-/- embryo and a wild-type littermate, processed for ISH with a p21Cip1 probe. Dorsal is up; ventral, down. OE, olfactory epithelium. Scale bar: 100 μm. (C) Horizontal sections of an E13.5 Gdf11-/- embryo and a wild-type littermate, processed as in B. nc, nasal cavity; A, anterior; P, posterior. Scale bar: 100 μm. (D, top) Immunofluorescence staining of migratory OE neuronal cells in explant cultures (after 14 hours in vitro), grown with or without Gdf11, then processed for anti-p21Cip1 immunoreactivity. (Bottom) Quantification of results from a typical culture experiment. Percentages of p21Cip1+ cells were: 2.5% of 587 counted cells in control cultures; 14.3% of 1065 counted cells in GDF11-treated cultures. P<0.05, Student's t-test.

