Fig. 8.
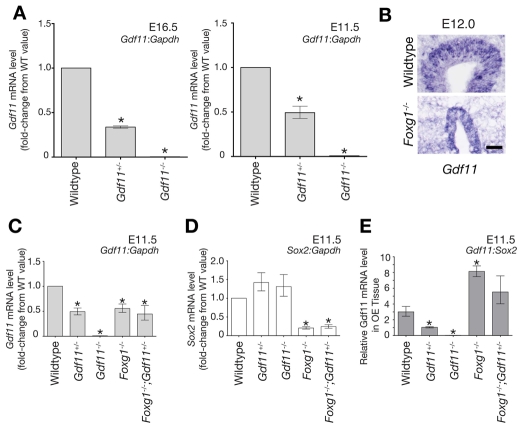
Analysis of Gdf11 mRNA expression in the OE of embryos of different genotypes. (A) Gdf11 does not regulate its own transcription. Gdf11 and Gapdh transcript levels at E16.5 and E11.5 were quantified by Q-RT-PCR, and dCT and ddCT values with errors were calculated as described in the Materials and methods. For presentation purposes, data are normalized to wild-type values. Statistics [Dunnett's test for multiple comparisons against a single control (DT) (Glantz, 2005)] were performed using mean dCT values and corresponding errors (s.e.m.), which were: E16.5, wild type=5.32±0.0233; Gdf11+/-=6.89±0.0523, Gdf11-/-=13.53±0.4933; E11.5, wild type=5.22±0.200, Gdf11+/-=6.24±0.009, Gdf11-/-=12.22±0.142. (B) Gdf11 is expressed in Foxg1-/- OE at E12.0. ISH for Gdf11 was performed on coronal cryosections of wild type and Foxg1-/-. Scale bar: 50 μm. (C-E) Relative Gdf11 and Sox2 expression values in OE from E11.5 embryos of different genotypes. Gdf11, Sox2, and Gapdh transcript levels were quantified by Q-RT-PCR as described in the Materials and methods. In C and D, Gdf11:Gapdh and Sox2:Gapdh expression levels are normalized to wild-type values for presentation purposes. Statistics (DT) were performed using mean dCT values and corresponding errors (s.e.m.), which were as follows: Gdf11:Gapdh, wild type=5.22±0.200, n=3; Gdf11+/-=6.24±0.009, n=2; Gdf11-/-=12.22±0.142, n=3; Foxg1-/-=6.07±0.088, n=3; Foxg1-/-;Gdf11+/-=6.39±0.422, n=3. Sox2:Gapdh: wild type=6.81±0.217, n=3; Gdf11+/-=6.30±0.116, n=3; Gdf11-/-=6.42±0.230, n=3; Foxg1-/-=9.09±0.083, n=3; Foxg1-/-;Gdf11+/-=8.85±0.176, n=3. (E) Gdf11 expression plotted as the ratio of the mean Gdf11 transcript level to the mean Sox2 level. Values that differ significantly from wild type (P<0.05, DT) are denoted by asterisks.

