Fig. 2.
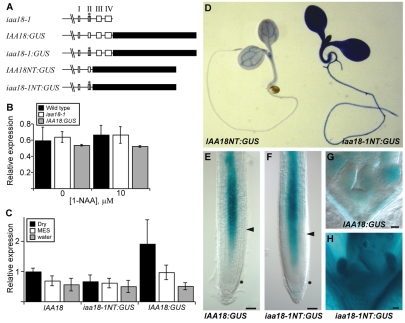
Expression of IAA18:GUS fusion constructs in transgenic plants. (A) IAA18:GUS fusion constructs. White boxes, IAA18 exons; black boxes, GUS gene; *, iaa18-1 mutation. (B) Expression level of IAA18 in wild-type, iaa18-1 and IAA18:GUS seedlings after mock treatment or after 40 minutes of treatment with 10 μM 1-NAA. (C) Expression levels of IAA18, iaa18NT:GUS and IAA18:GUS genes either untreated (dry) or after immersion in water (pH 7.4) or 50 mM MES (pH 5.4). In B and C, signals from RNA blot hybridizations of the indicated genes were digitized and normalized to signals from β-tubulin, and then each value was normalized to the untreated wild-type value from the first experiment. Error bars indicate s.d. of normalized measurements from four (IAA18 and iaa18-1) or two (IAA18:GUS) blots. (D-H) Six-day-old seedlings stained with X-gluc. (D) IAA18NT:GUS (left) and iaa18-1NT:GUS (right). (E,G) IAA18:GUS in root (E) and shoot (G) meristems. (F,H) iaa18-1NT:GUS in root (F) and shoot (H) meristems. In E and F, asterisks mark the level of the quiescent center and arrowheads indicate the point at which cells begin to elongate. Scale bars: 190 μm.

