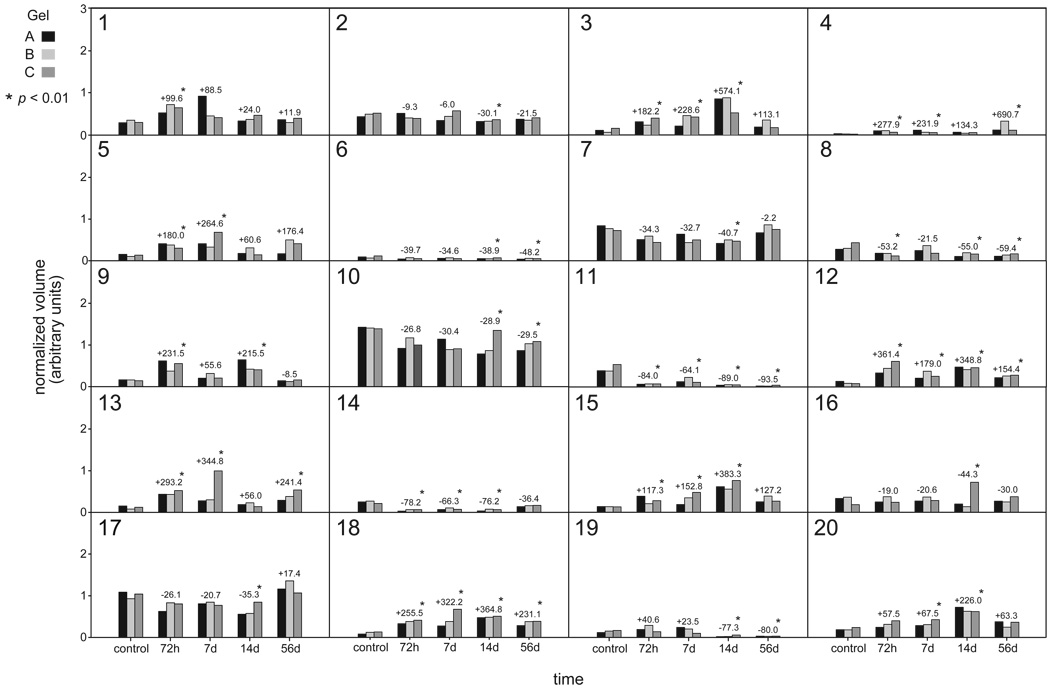
Figure 4.
Summary of statistically significant changes in protein expression level (normalized volume) for 20 protein spots in post-injection gels compared with control gels. Histogram bars represent normalized volume levels for spots in standard gels (3 per experimental group). Numeric annotations above the histogram bars represent percentage change in normalized volume from control, for spots in synthetic gels from each experimental group.

