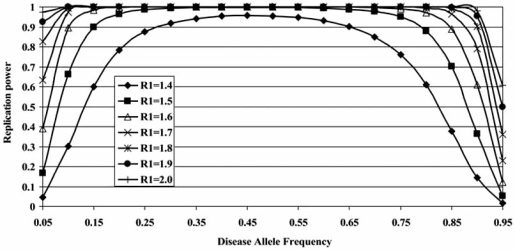
Fig. (4).
Power to detect and replicate association as a function of genotype relative risk (R1) and disease allele frequency. The analysis assumes a two-stage design as described by Skol et al. [89], although modified so that power is calculated for TDT rather than case-control sampling. The total sample size is 2,100, with 700 trios included in stage 1 and 1,400 trios included in stage 2. Power is computed assuming that the disease locus operates in a multiplicative fashion and for a genome-wide significance of .10.

