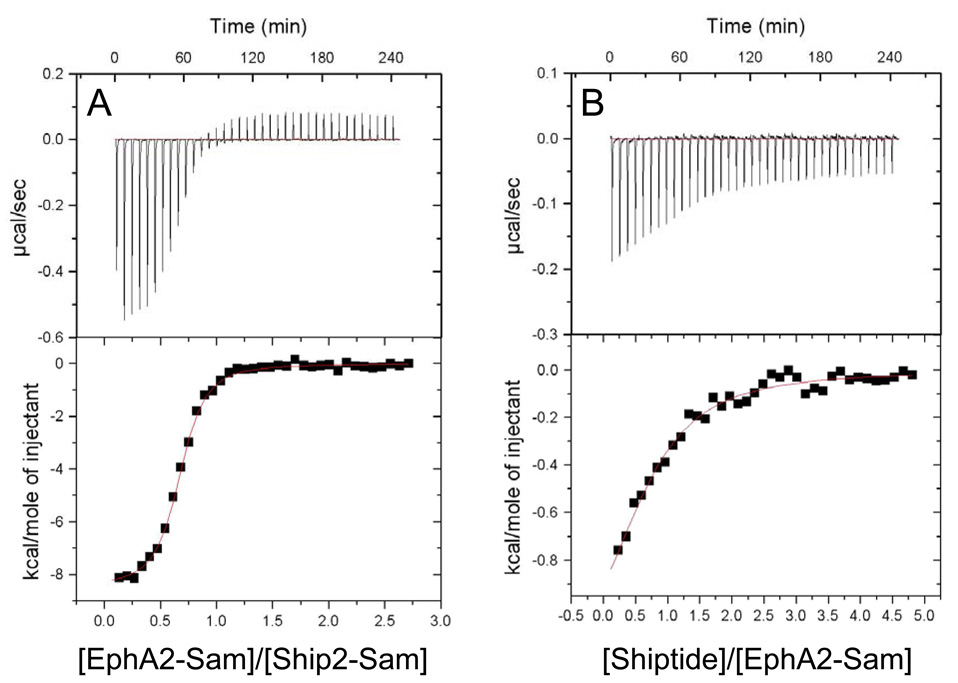
Figure 5.
ITC studies. A. The raw and integrated data are shown in the upper and lower panels respectively. In the lower panel, solid squares represent data from the EphA2-Sam (300 µM) titration into Ship2-Sam solution (25 µM); the solid red line represents the fit to a single binding site model. B. Calorimetric curve representing the EphA2-Sam (50 µM) titration with the Shiptide peptide (1 mM).

