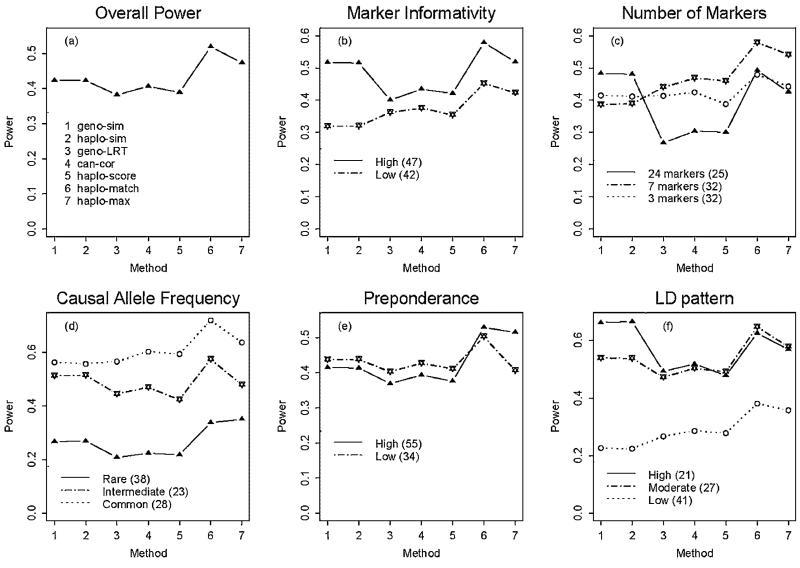
Fig. 1.
Power according to five properties. The x-axis gives a number for each method and the y-axis is the average power under the significance level 0.05. (a) The overall power performance—the average power over all 89 scenarios. (b) The power performance stratified by marker informativity. There were 47 simulation scenarios with high marker informativity and 42 scenarios with low marker informativity (in the parentheses are the numbers of scenarios and the power is the average power over these scenarios). (c) The power performance stratified by the number of markers. (d) The power performance stratified by the causal allele frequency. (e) The power performance stratified by the preponderance of the most common high-risk haplotype. (f) The power performance stratified by the linkage disequilibrium (LD) pattern between the causal single-nucleotide polymorphism (SNP) and its flanking markers.

