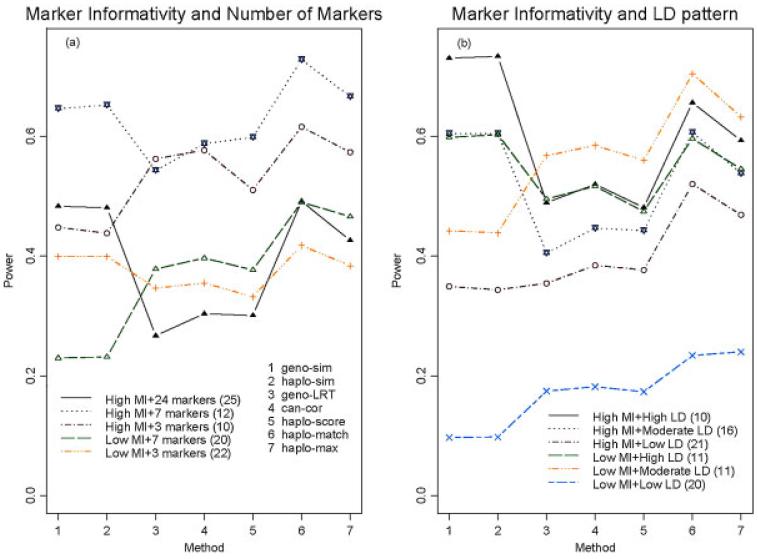
Fig. 2.
Power according to marker informativity, number of markers, and the linkage disequilibrium (LD) pattern. The x-axis gives a number for each method and the y-axis is the average power under the significance level 0.05. (a) The power performance stratified by the marker informativity and the number of markers. The first stratum “High MI+24 markers (25)” means that there were 25 simulation scenarios under high marker informativity and using 24 markers, and the power is the average power over these 25 scenarios. (b) The power performance stratified by the marker informativity and the LD pattern between the causal SNP and its flanking markers. The first stratum “High MI+High LD (10)” means that there were 10 simulation scenarios under high marker informativity and high linkage disequilibrium (LD), and the power is the average power over these ten scenarios.

