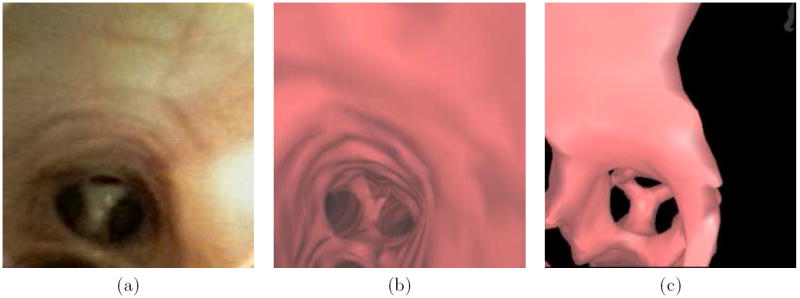
Figure 10.

A comparison a bronchoscopic video frame (a) with endoluminal renderings (b) and (c) of patient 20349.3.28 (also used for Figures 8 and 9). The visually-accurate rendering (b) was generated after running through the proposed method of Section 2.3. Part (c) depicts an unacceptable rendering, produced by a previously-proposed surface definition method at the same location as parts (a-b) [10,11,41].
