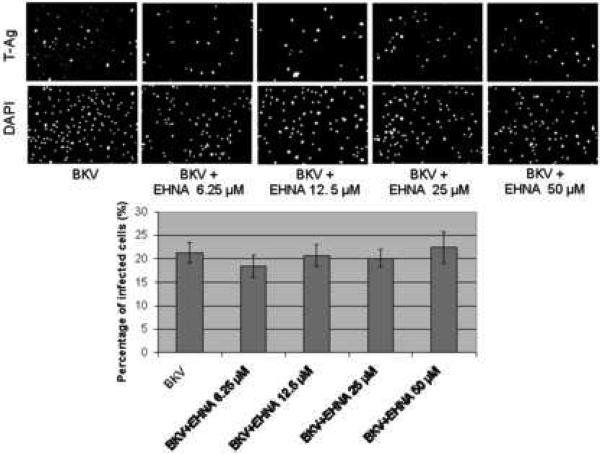
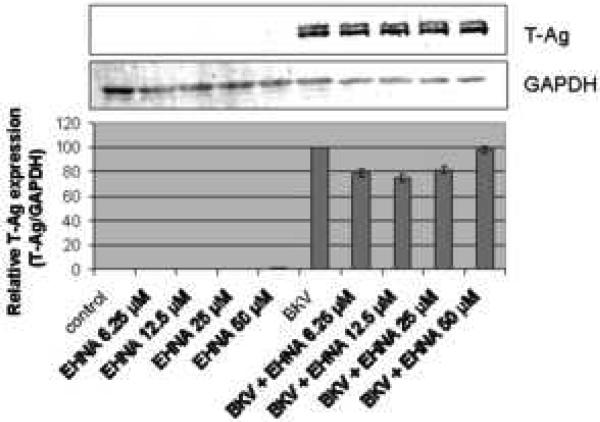
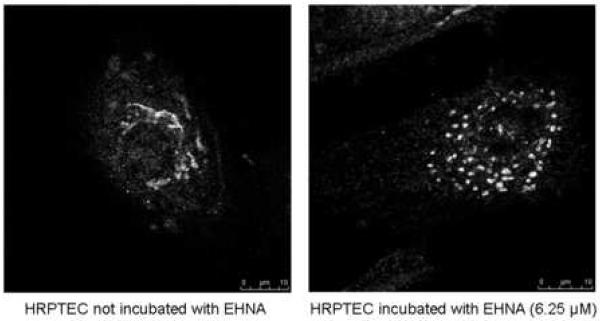
FIGURE 4. EHNA was not required for BKV infection.
HRPTEC were pre-incubated EHNA (6.25, 12.5, 25, and 50 μM) for 1 hour prior to co-incubation with BKV (MOI 0.5 FFU/cell) and EHNA for 72 hours. Medium was removed, cells were washed three times with REBM with 0.5 % FBS and incubated for another 48 hours with fresh medium containing EHNA. (A) After incubation, cells were fixed and analyzed by IF (Magnification ×20). T-Ag positive cells were counted as BKV infected cells and the percentage was calculated against DAPI stained nuclei as total cells. At least 500 cells were counted from each three independent cover slips and means and SE were calculated from two independent experiments. (B) After incubation, cells were harvested and analyzed by WB. Relative T-Ag expression was expressed as graph bars following measurement of the band intensity by Odyssey®. Relative Intensity of T-Ag expression was normalised by the use of GAPDH band intensity as loading control. Means and SE were calculated from two independent experiments. In this instance control means HRPTEC not incubated with either BKV or EHNA. BKV means HRPTEC incubated with BKV alone. (C) HRPTEC were incubated with or without several doses (6.25, 12.5, 25, and 50 μM) of EHNA for 5days. After incubation, cells were fixed, immunofluorescenced by Golgi marker Mannosidase II and analyzed by confocal microscope with 63× objective lens. Bars are 10 μm.


