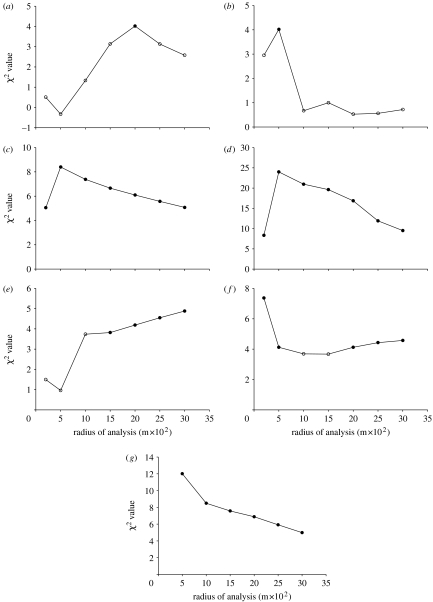
Figure 3.
Cross-scale resilience in (a,b) the New Jersey/Pennsylvania system (Bombus impatiens and Lasioglossum rohweri, respectively) and (c–g) the California system (Agapostemon texanus, Bombus spp., Halictus tripartitus, Hylaeus spp. and Melissodes spp., respectively). Each figure shows the Χ2 value from a generalized linear model regressing a species' abundance against the proportion of native vegetation in the surrounding landscape at a given radius. Filled circles represent significant relationships. Only the species having significant negative associations with native vegetation loss are shown. These species respond most strongly at different scales, demonstrating cross-scale resilience.

