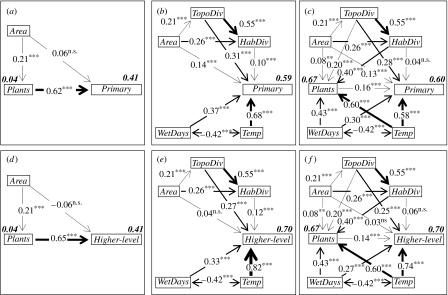
Figure 4.
(a–f) Structural equation models of the relationships between plant richness, environment, and primary and higher-level consumer vertebrate richness. (a,d) Direct effects of plant richness, (b,e) environmental effects on vertebrate richness and (c,f) combined environmental/richness model. The numbers at bidirectional relationships represent correlations among predictors. Standardized path coefficients are shown for all unidirectional relationships. These illustrate the effects in units of standard deviation or, in other words, the correlations that represent the variation associated with a relationship. The width of the arrows indicates the strength of the effects. Numbers in bold italics next to dependent variables indicate squared multiple correlations.

