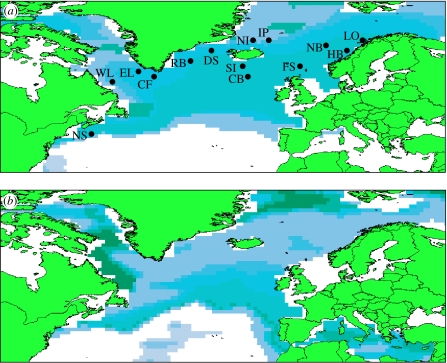
Figure 1.
(a) Present and (b) LGM modelled distributions of C. finmarchicus based on current day and reconstructed sea surface temperature and bathymetry under the maximum entropy niche model. Labelled dots in (a) show sampling points (see table 1 for details).

