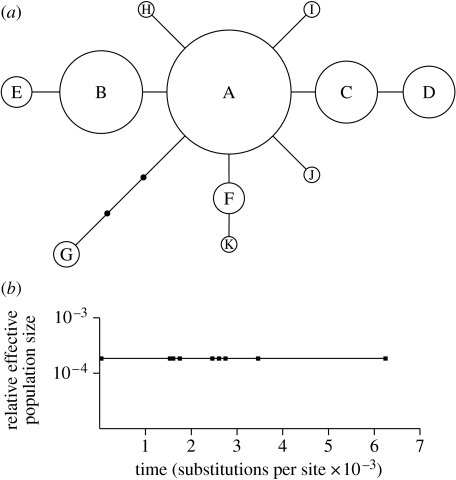
Figure 2.
(a) Mitochondrial CYTB haplotype network. Circle sizes are approximately proportional to haplotype frequency. Haplotype codes correspond to those in electronic supplementary material, table S1. (b) Generalized skyline plot for C. finmarchicus generated from the CYTB haplotype network. Based on the calculated mutation rate of 1.11–1.75 per cent/Myr, the final coalescent (i.e. rightmost) point corresponds to a time of ca 359 000–566 000 BP.

