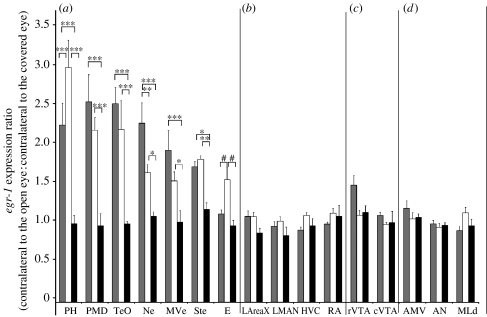
Figure 4.
Quantification of ratios of egr-1 expression between hemispheres in (a) visual areas, (b) song nuclei, (c) motivation-related areas and (d) motor-associated and auditory areas. n=5 for female-directed singing (FD, grey bars); n=5 for silent alone (SA, white bars); n=3 for silent dark (SD, black bars). Each bar shows an average value±s.e.m. *p<0.05, **p<0.01, ***p<0.001, representing differences between hemispheres (contralateral to the open eye: contralateral to the covered eye) across groups (two-way repeated-measures ANOVA). The hash symbol represents the p-value that approached significance (p=0.022, α-level=0.017).

