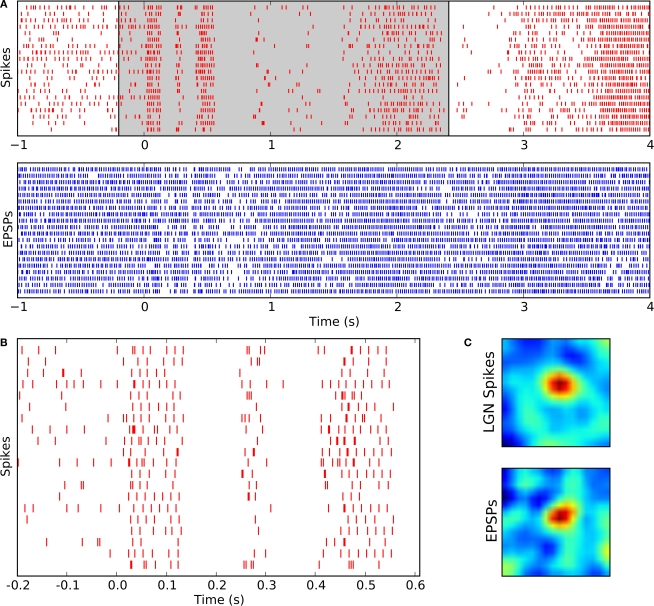
Figure 2.
Timing of retinogeniculate EPSPs and thalamic spikes recorded intracellularly from a single relay cell during the presentation of natural movies. (A) Rasters of spikes (red, top) and EPSPs (blue, bottom) recorded during multiple trials of a movie clip that began at time t = 0. The shaded area marks the data range that is shown in (B) at higher magnification. (B) Spike times centered on the beginning of each clip shown at an expanded scale. (C) Receptive fields for spikes (top) and EPSPs (bottom) mapped from responses to a movie; red indicates excitation to bright and blue excitation to dark.

