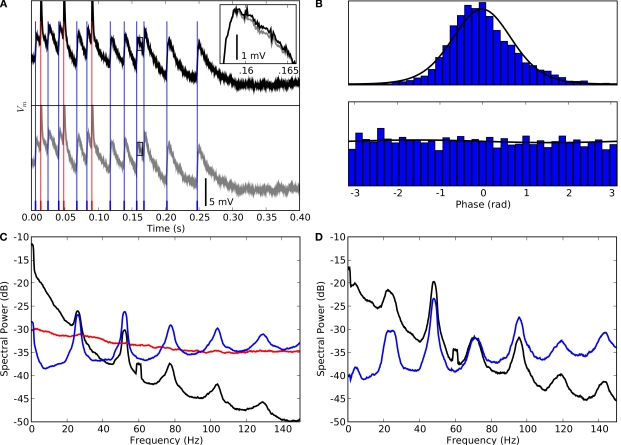
Figure 4.
Controls for potential artifacts introduced by power line or the stimulus. (A) Example of a recording contaminated with artifacts from the power line before (bottom panel, gray trace) and after (top panel, black trace) removal of line noise (60 ± 0.1 Hz). The shapes of the EPSPs in both traces are very similar; vertical lines mark timings of spikes (red) and EPSPs (blue). The inset shows a single EPSP at higher magnification (marked by the rectangle in the main plot). (B) Phase distribution of EPSPs relative to band passed (51.5 ± 2 Hz) membrane potential (top) and to line noise (60 ± 0.1 Hz) (bottom). (C) Spectra of membrane potential (black), spikes (red) and EPSPs (blue) recorded during the presentation of a natural movie; the spectral peak is at 52 ± 2 Hz. (D) Spectra obtained from recordings of the same cell as in (A–C), but with the eyes occluded; the peak frequency is slightly lower, 48 ± 2 Hz than when the eyes were open.

