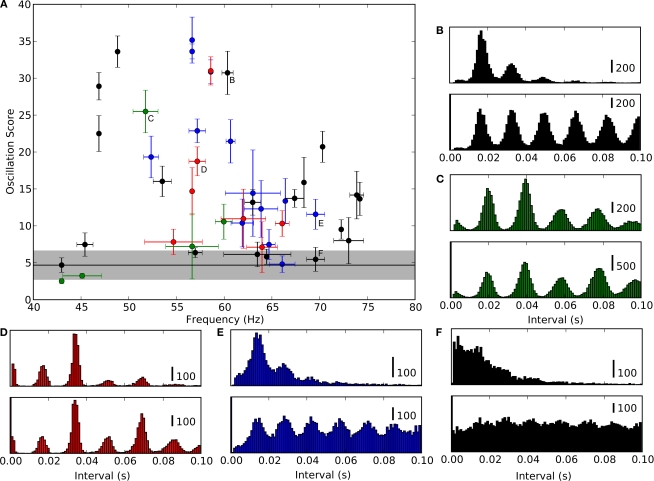
Figure 6.
Range of oscillation strengths within the population. (A) The strength of oscillations for individual cells quantified by plotting oscillation score against oscillation frequency. Values for intracellularly recorded thalamic spikes are red, EPSPs, blue, EPSCs (recorded in voltage clamp), black, and extracellularly recorded retinal spikes, green. The shaded region shows the range of scores for cells that did not oscillate consistently (σf > 4, see Table 1 and main text). Lettered points refer to corresponding panels, (B–F), which show spike interval histograms (top) and autocorrelograms (bottom) for cells with different oscillation scores.

