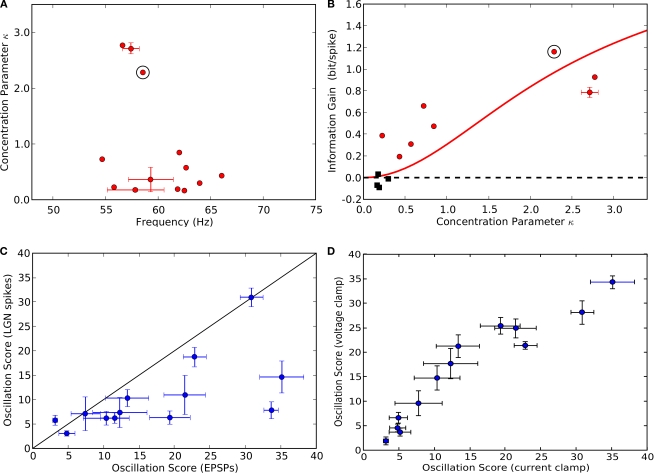
Figure 9.
Population results for phase locking, information gain and oscillation score. (A) Phase locking of thalamic spikes for all (13/20) cells that had oscillating EPSP trains (see Table 1). Error bars indicate standard deviation for cases in which multiple movies were presented; circled point indicates the cell analyzed in Figures 2, 3, 7 and 8. (B) Gain in information rate after de-jittering plotted against concentration parameter κ; conventions as in (A). For 8 of 20 cells (red points), the information increased significantly (p < 0.05, computed using permutation test) after de-jittering of the spike train (see A). Red curve depicts gain in transmitted information predicted by our model (Figure 10) for variable κ. (C) Oscillation scores of thalamic spikes plotted against oscillation scores of retinal inputs (EPSPs). (D) Oscillation scores for retinal inputs recorded in voltage clamp (EPSCs) plotted against the scores for retinal inputs (EPSPs) recorded in the current clamp.

