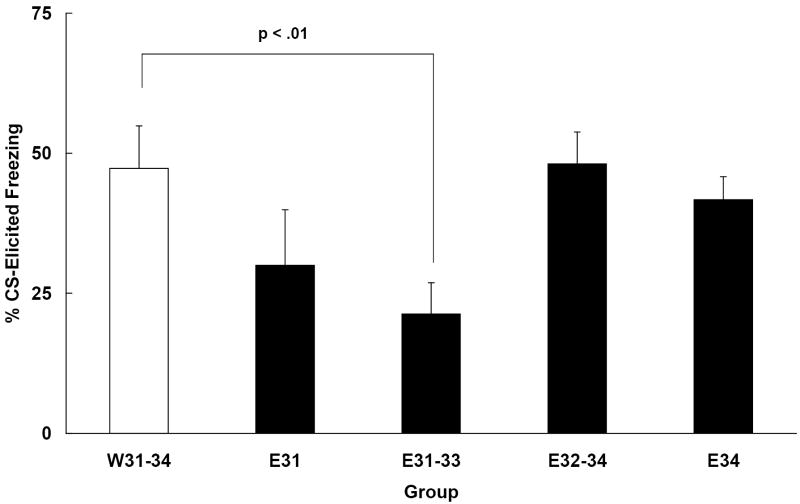
Figure 3.
Mean (+/- SEM) change in freezing (%CS freezing - %pre-CS freezing)recorded during a test session that occurred on PD 35 in Experiment 3. Subjects were all given trace conditioning trials, in which a 10 s trace interval was used, on PD 30. Animals differed in the timing of ethanol administration post-training. Some subjects were given ethanol beginning 24 h after training (E31 and E31-33) while some subjects were given ethanol closer to the day of test (E32-34 and E34). The control group (W31-34) was given water on each of the four days between training and test.

