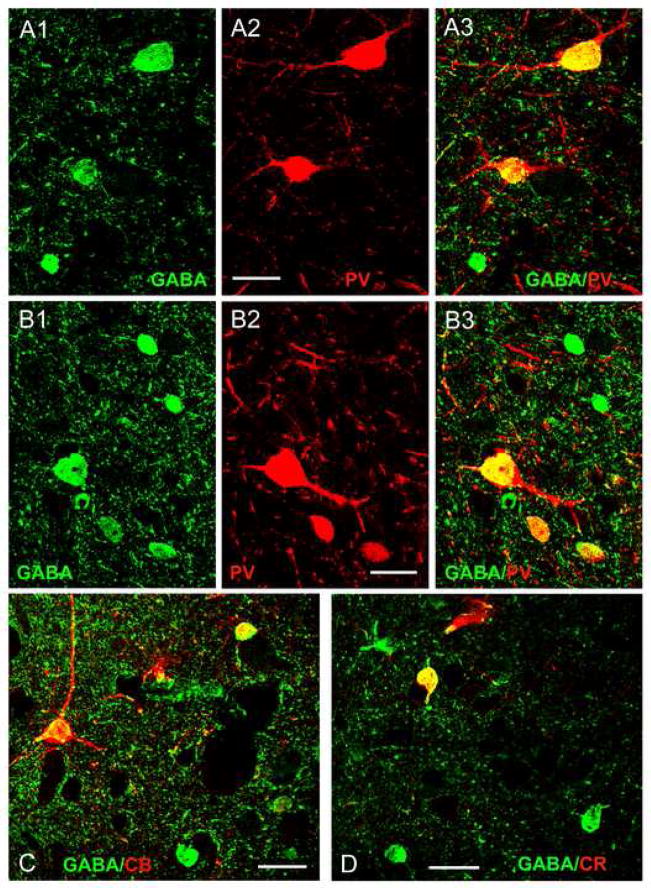
Fig. 2.
Colocalization of GABA and calcium-binding proteins using immunofluorescence confocal laser scanning microscopy. (A1–A3) Colocalization of GABA and PV in the Bmc: (A1) Three GABA+ somata (green). (A2) Two PV+ somata (red) in the same field. (A3) Merging of the red and green channels indicates that both of the PV+ somata express GABA (yellow). (B1–B3) Colocalization of GABA and PV in the Ldi: (B1) Several GABA+ somata (green). (B2) Three PV+ somata (red) in the same field. (B3) Merging of the red and green channels indicates that all three of the PV+ somata express GABA (yellow). C) Colocalization of GABA (green) and CB (red) in the Ldi. Colocalization of GABA and CB is indicated in yellow in this merged image. D) Colocalization of GABA (green) and CR (red) in the Bmc. Colocalization of GABA and CR is indicated in yellow in this merged image. Scale bars = 25 μm for all images.

