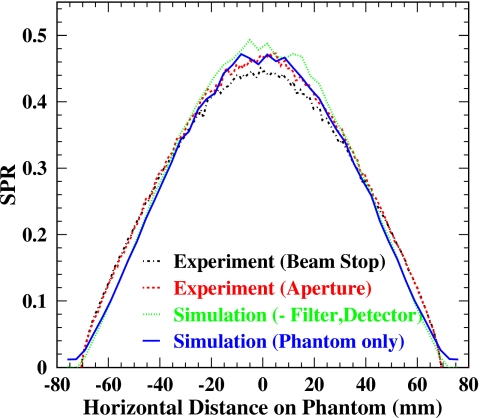
Figure 13.
SPR profile comparison of the experiments after background scatter subtraction with the simulation results. At the center, both measurements are consistent within 5%, and the background subtracted simulation agrees with the phantom-only simulation within 5%. Both measurements also agree with the phantom-only simulation within 5%.

