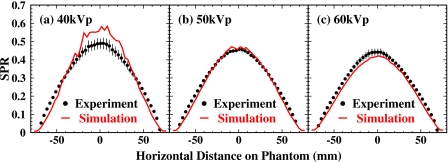
Figure 14.
Spectral dependence of the SPR from the measurements and the GATE simulations at 40, 50, and 60 kVp. Solid circles and their associated error bars are average values and differences of the measured SPRs by the beam stop and aperture methods after background scatter subtraction. Solid curves are the simulated SPRs for the phantom only.

