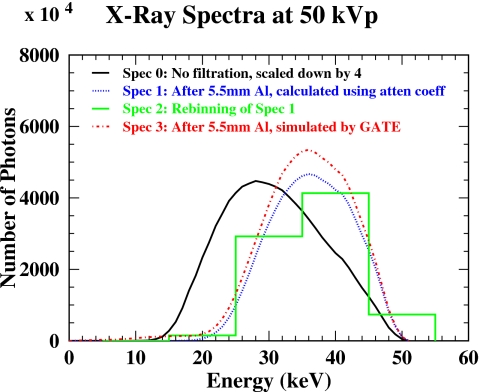
Figure 3.
The x-ray spectra for tungsten target at 50 kVp. The curves show relative intensity in 1 keV intervals. Spectrum 0 was generated by the TASMIP algorithm as no filtration was involved. Spectrum 1 was then recalculated to include 5.5 mm Al filter absorption using known aluminum attenuation coefficients at different x-ray energies. Spectrum 2 is the rebinning of spectrum 1 in 10 keV energy intervals. Spectrum 3 was collected after the simulated photons (according to spectrum 0) were transmitted through the 5.5 mm thick aluminum by the GATE Monte Carlo simulation.

