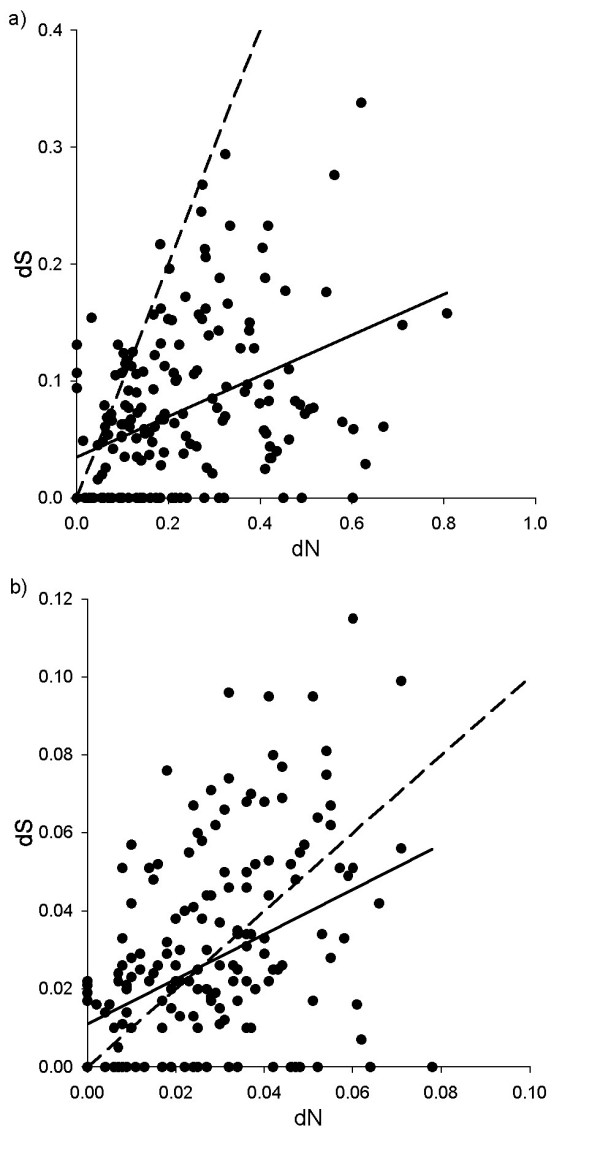
Figure 3.

The relationship between non-synonymous (dN) and synonymous (dS) substitution rates at the a) ABS contact residues and b) ABS non-contact residues. Points are lineage-specific data when species are separated; solid lines are regression lines; dashed lines indicate y = x, which corresponds to neutrality. Regions below the neutral line denote positive selection pressure (dN > dS or dN:dS > 1).
