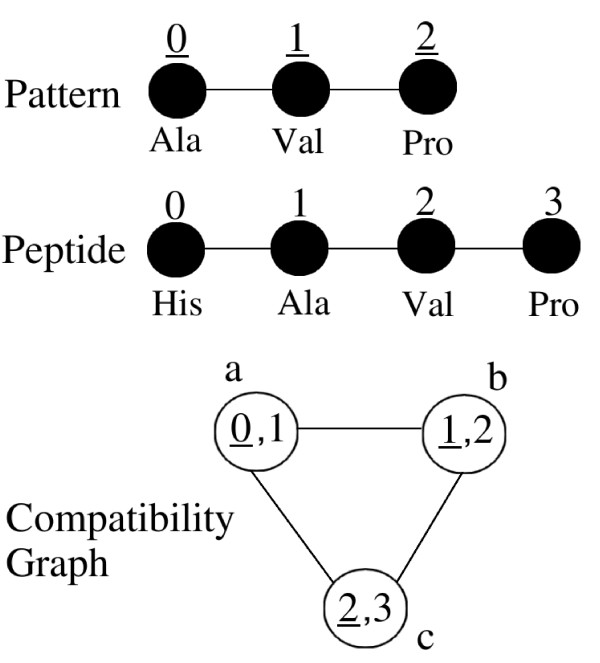
Figure 2.
A simple example of compatibility graph. The Figure shows a pattern graph, a peptide graph and the corresponding CG. Each node of pattern and peptide graphs has a label (for example 'Ala') and a number that is a unique identifier of this node. Identifiers of pattern nodes are underlined in order to distinguish them from peptide nodes. A node of the CG corresponds to the association of a node of the pattern graph (underlined number) and a node of the peptide graph with the same label. Nodes of the CG are named by letters. For example, node 'a' corresponds to the association of pattern node 0 and peptide node 1 that have both label 'Ala'. Edges between nodes 'a' and 'b' and between nodes 'b' and 'c' in the CG correspond to condition (1). Edge between nodes 'a' and 'c' corresponds to condition (2) of the definition of CG. A clique of size 3 exists in the CG and corresponds to the occurrence of the pattern in the peptide.

