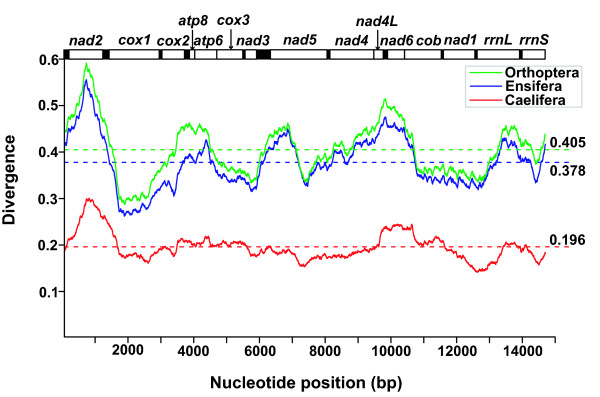
Figure 2.
Plot of divergences among the Orthoptera mtDNA sequences excluding the A+T-rich region. The bar at the top illustrates the position of protein-coding genes and rRNAs, and the tRNAs are represented as black boxes. Dashed lines indicate mean divergence. The window is 1,000 bp in length and slides 1 bp at a time. The sliding-window analysis calculates the divergence of the 14 orthopterans, the 7 caeliferans, and the 7 ensiferans, respectively.

