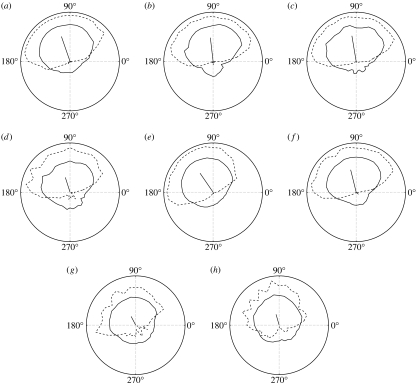
Figure 4.
Polar plots of estimated priors for eight observers. Each graph shows the frequency of convex responses (dashed) as a function of light-source direction. This is essentially a sample from the observer's posterior, and is used to estimate the prior (solid). For display purposes, the lengths of all mean vectors (solid line) have been scaled by the same factor across all graphs, and all graphs are drawn to the same scale (see appendix C). Note that all biases are to the left, with values of 20°, 7°, 9°, 18°, 34°, 14°, 28° and 16°, respectively (mean 18°). These results were obtained using all the data for each observer with λ=400 and σ=2.

