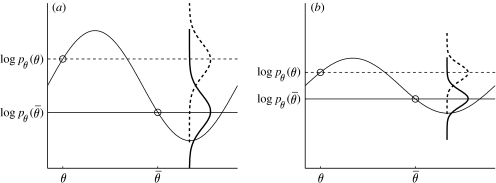
Figure 5.
The discrimination parameter σ is undetermined. (a) Graph of an example log prior, log pθ(θ) (solid horizontal sinusoid curve), as a function of lighting direction θ. Given two hypothetical neurons with preferred lighting directions θ and , their responses are determined by their log probability density functions, log p(θ) and , indicated by the vertical dashed and solid curves, respectively. For a given stimulus, the larger of the two observed values from the probability density functions log p(θ) and determines the lighting direction assumed by the observer, and this, in turn, determines the concave/convex observer response. These two observed values are noisy estimates of the probability density function means, so the choice probability q (see equation (2.19)) is determined by the relative overlap of the probability density functions (vertical dashed and solid curves) for these two quantities. (b) A log prior with amplitude variations k times smaller than in (a) leads to the same choice probabilities as in (a), provided the noise level σ is also reduced by a factor k. (For simplicity, this analysis assumes a concavity preference of 0.5.)

