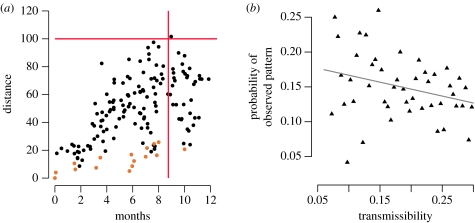
Figure 4.
Spatial spread of CDV. (a) Representative example of a simulated epidemic that began in the subset and swept through the entire population, occasionally returning to the subset. Points indicate the time and distance from first infection of each infected pride (brown, subset prides; black, other prides). Red lines represent the observation that the 1994 CDV epidemic took 35 weeks to reach 100 km from the study area. (b) The probability that the observed (1994) correlogram would arise from the model across transmissibilities. This probability is the fraction of simulations that lay both below the red line in figure S1b and above the red line in figure S1c in the electronic supplementary material. Line is the least-square linear regression line (p<0.05).

