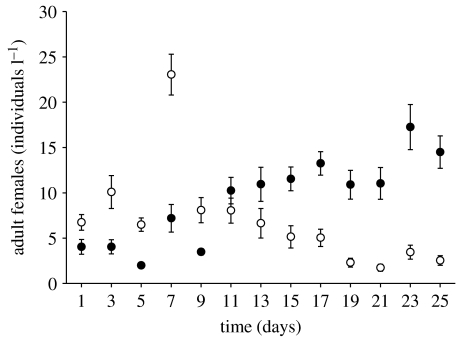
Figure 3.
Population dynamics of the invasive D. lumholtzi (filled circles) and the native D. pulicaria (open circles) over time (days) in the fish predation experiment. After an initial growth period of 10 days, sampling started on day 1. The densities of adult females (individuals l−1) are shown per species as means (±s.e.) of the 10 mixed-species replicates. Prior to sampling, fish predation took place every second day. Note that the predation period was extended on day 7.

