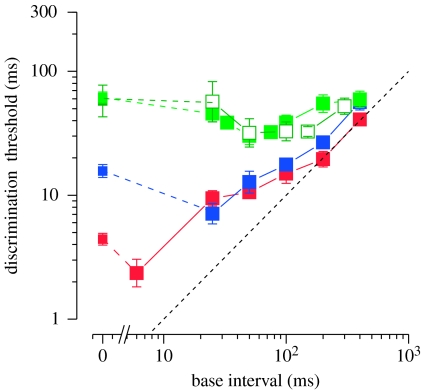
Figure 4.
Discrimination thresholds as a function of base interval. The data were averaged over the five subjects (geometric mean) and plotted on logarithmic coordinates. All curves have the same general shape, but the duration associated with minimum threshold varies across conditions. The black dashed line represents unity slope, or Weber's law relationship (red, auditory; blue, visual; green, visual first; white, auditory first).

