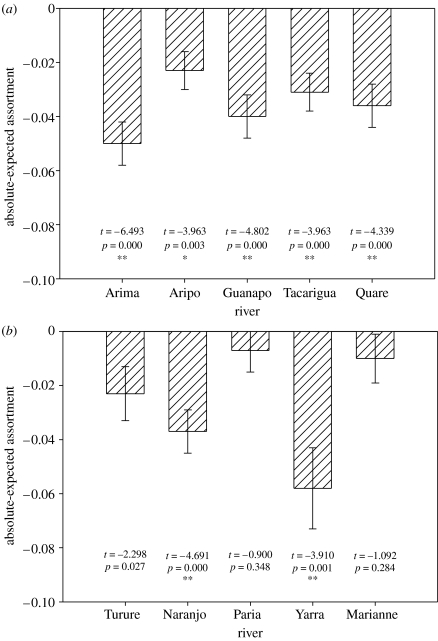
Figure 1.
Patterns of body length assortment (mean±(1 s.e.) absolute-expected assortment) within (a) high predation risk and (b) low predation risk rivers. Also shown are the results of one sample t-tests comparing the difference in assortment (absolute assortment−expected assortment) with the expected value of 0. Results are significant at *p<0.05 and **p<0.01 after Bonferroni corrections.

