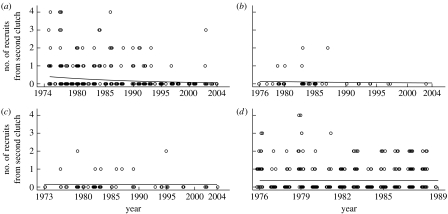
Figure 3.
Temporal trend in the number of recruits from the second clutch for each population, fitted from the equations from the population-specific GLMMs with Poisson error structure (see text for further details). The equations fitted were (all on a log scale): −0.858−0.062×year, −1.865−0.037×year, −1.891−0.004×year, −0.999−0.002×year for the (a) HV2, (b) LB, (c) OH and (d) VL populations, respectively. Note that some population–year combinations are missing (see table 1 for details).

