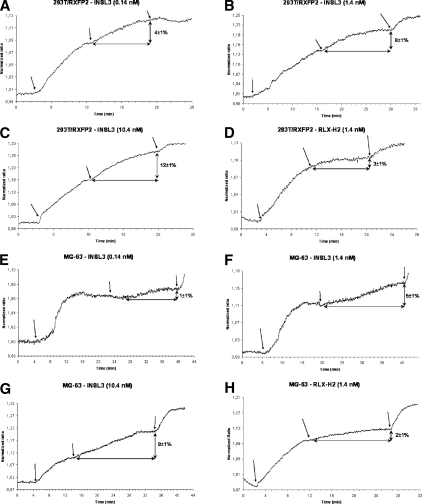
FIG. 2.
Real-time imaging of cAMP in living cells by FRET imaging on 293T cells transfected with RXFP2 cDNA (positive control) (A–D) and the MG-63 osteoblast cell line (E–H), stimulated with INSL3 peptide (A–C and E–G) and recombinant human relaxin (D and H) at different doses. All the experiments were performed by blocking phosphodiesterase with IBMX (arrow on left) and controlling cell viability at the end by directly stimulating adenylate cyclase with forskolin (arrow on right). Figures show the results of one of 5–10 experiments. The percentage in intracellular cAMP increase from the plateau after IBMX is indicated as mean ± SE. INSL3 determines a dose- and time-dependent cAMP increase in MG-63 cells and 293T control cells. Minimal cAMP increase is observed after relaxin stimulus both in MG-63 cells and 293T control cells.

