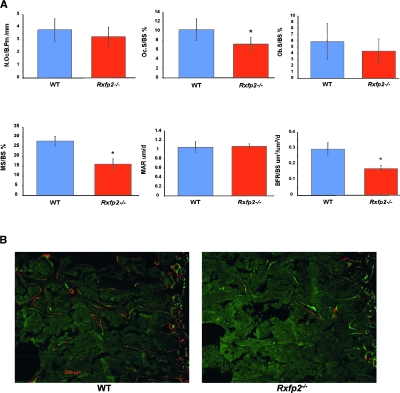
FIG. 5.
Static and dynamic (bone formation indices) histomorphometric analysis of lumbar spine of WT and Rxfp2−/− mice. (A) Histograms showing the number of osteoclasts per bone perimeter (N.Oc/B.Pm, mm), the osteoclast surface (Oc.S/BS, %), the osteoblast surface (Ob.S/BS, %), the mineralizing surface (MS/BS, %), the mineral apposition rate (MAR, μm/d), and the bone formation rate (μm3/μm2/d). *p < 0.01. (B) Representative double label images showing the incorporation of the two fluorescent dyes (Alizarin-3-methylmino-diacetic acid and calcein), injected 4 days apart, into the mineralizing osteoid and showing the dramatic difference in MS/BS.

