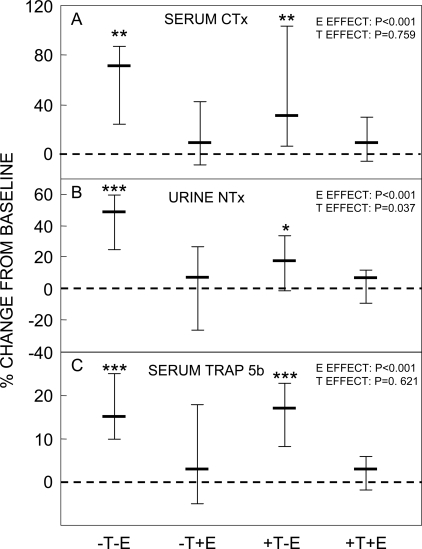
FIG. 2.
Percent change from baseline in (A) serum CTX, (B) urine NTX, and (C) serum TRACP5b levels in the four study groups between the baseline and final visits. *p < 0.05, **p < 0.01, and ***p < 0.001 for change from baseline. The overall effect of E and T on the bone markers was analyzed using the two-factor ANOVA model described in the Materials and Methods section. Shown are the medians and interquartile ranges.

