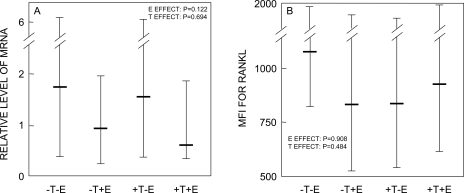
FIG. 4.
(A) Normalized (to the control group, group D) RANKL mRNA levels in MACS-sorted ALP+ cells and (B) MFI for RANKL Ab in ALP+/RANKL+ cells analyzed by flow cytometry in the four groups. The overall effect of E and T was analyzed using the two-factor ANOVA model described in the Materials and Methods section. Shown are the medians and interquartile ranges.

