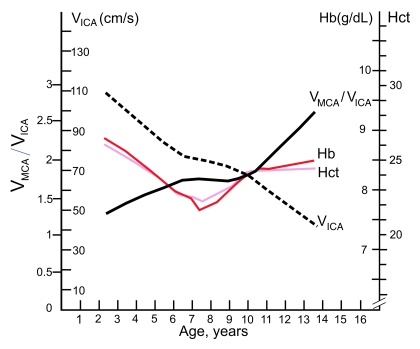
Figure 4:
Graph depicts age-dependence curves for mean blood flow velocities in extracranial portion of the right ICAs, mean VMCA/VICA ratio on the right side, hemoglobin concentration (Hb), and hematocrit value (Hct) in children with SCD. The velocity changes with age in the ICA are very similar to age-related changes in hemoglobin and hematocrit up to the age of 10 years, while the ratio shows opposite trend. Lines were obtained from distance-weighed, least-squares smoothing of individual corresponding values.

