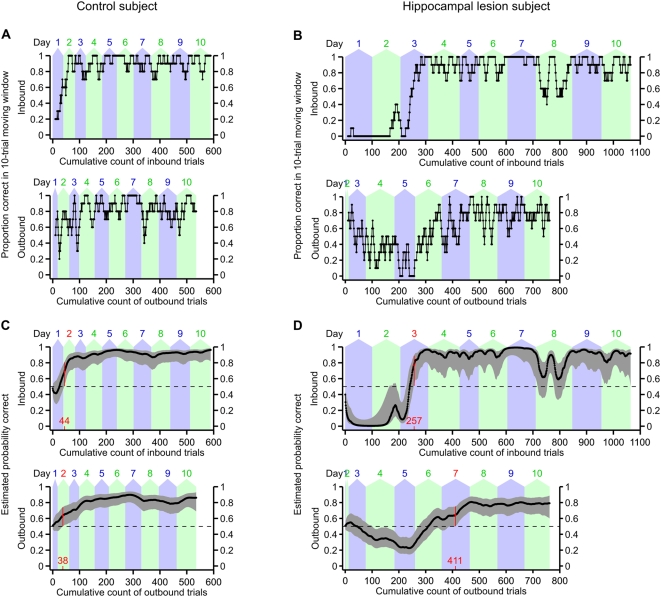
Figure 4. Examples of learning curves on the W-track continuous alternation task for two subjects.
(A) 10-trial moving average of proportion correct for a control subject. The top plot shows performance on inbound trials, while the bottom plot shows performance on outbound trials. Trials are counted cumulatively along the horizontal axis, starting with the first trial on day 1 and ending with the last trial on day 10. The alternating blue and green background shading indicates the number of trials completed on each day. (B) 10-trial moving average of proportion correct for a lesion subject. (C) Smooth learning curve estimated using the state-space model of learning, for the same subject as in (A). The top plot shows the estimated learning curve for the inbound component of the task, while the bottom plot shows the estimated learning curve for the outbound component of the task. Trials are counted cumulatively along the horizontal axis in the same manner as in (A). Black dots indicate maximum-likelihood estimates of the probability of correct performance, and gray errors bars indicate point-wise 95% confidence intervals. Dashed horizontal lines indicate the chance performance level (1/2) that would be expected if the subject randomly chose the next destination food well. We defined the learning criterion (highlighted in red) as the earliest trial at which the 95% confidence interval of the learning curve exceeded this chance level and remained above chance for two full consecutive days. (D) Similar to (C), but for the same hippocampal lesion subject as in (B). The initial low dip of the inbound learning curve, and the paucity of outbound trials, reflects the many perseverative inbound errors that this subject made during the first two days of testing. This subject's peformance on the inbound component of the task regressed transiently on day 8 for unknown reasons.

