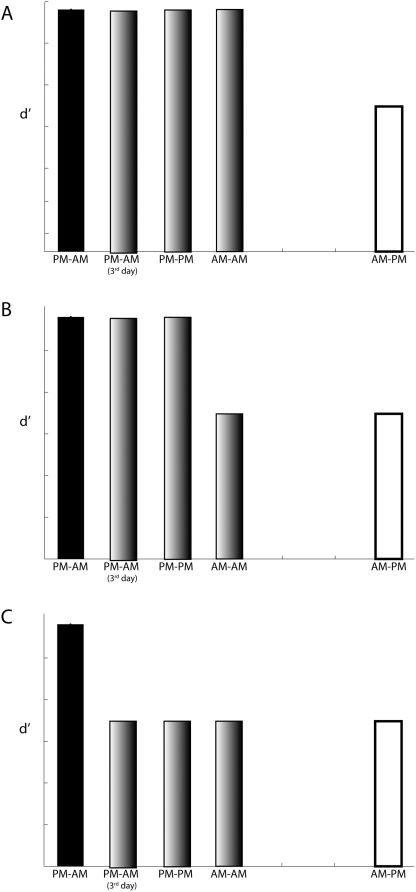
Figure 4. Three hypothetical scenarios of test performance (d′).
Groups that sleep for the majority of the retention period are illustrated by black solid bars, groups that remain awake throughout retention are coded white, and groups that experience time in sleep as well as wake during retention are coded gray. (A) A hypothetical scenario in which a night of sleep during the retention period increases d's is shown. (B) A hypothetical scenario in which a night of sleep immediately following acquisition increases d's is shown. (C) (B) A hypothetical scenario in which a substantial time spent awake (12 hours or more) during the retention period leads to lower d's is shown.

