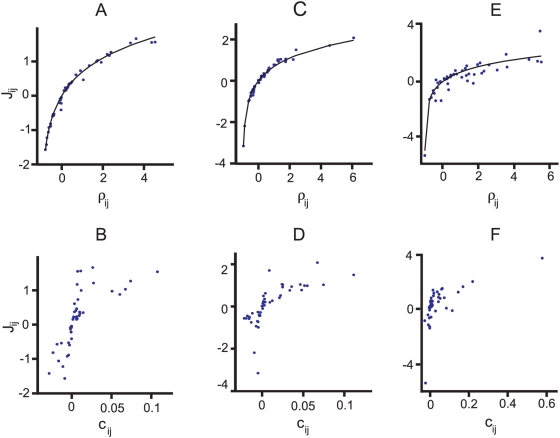
Figure 7. The relation between pairwise couplings and pairwise correlations.
This figure shows that there is a simple relation between  and
and  , but not between
  and
and  . (A, C, E)
  versus the normalized coefficients,
  (blue points), along with the predicted relationship,
via Eq. (18b) (black line). (B, D, F)
  versus the Pearson correlation coefficients,
  , Eq. (26) (blue points). The three columns correspond
exactly to the columns in Fig. 5 from left to right; that is,
  for (A, B),
  for (C, D), and
  for (E, F). The prediction in the top row (black line)
matches the data well, even in the rightmost column.

