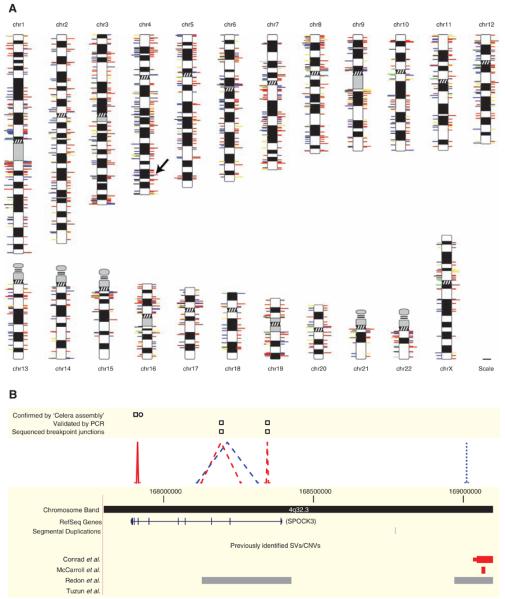
Fig. 2.

SVs identified in two humans. (A) SVs mapped onto chromosomal ideograms (12). Right side: Red, deletion; blue, insertion; and yellow, inversion. Double length indicates SVs observed in both individuals. Left side: Log-scale size of an event (events ≥1 Mb are drawn at same length, corresponding to the maximum length of a line); unmated insertions [i.e., events lacking a predicted breakpoint and thus size information (12)] and simple insertions (12) are depicted with 1-kb lines; line colors indicate repetitive sequences in ±3-kb window of the predicted breakpoint junction (12): red, SDs; blue, LINEs; yellow, LTRs; green, satellites; black, two or more repetitive elements with equal frequency; gray, no repeat association. The arrow indicates the region in (B). A high-resolution image of this figure is available as fig. S1. (B) Amplified view of chromosome 4 region. SVs in NA18505 are indicated with dashed lines (validation: squares); NA15510, dotted lines (validation: circle). SVs shared between individuals are solid lines. Colors are as in (A).
