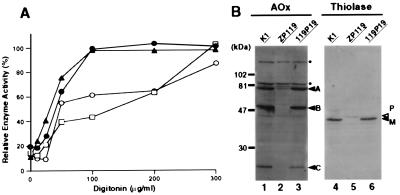
Figure 3.
Complementation of biogenesis of peroxisomal enzymes. (A) Latency of catalase activity in CHO-K1, ZP119, and 119P19 cells. □, CHO-K1; ●, ZP119, ○, 119P19; ▴, lactate dehydrogenase in ZP119. Relative free enzyme activity is expressed as a percentage of the total activity measured in the presence of 1% Triton X-100 (5). The results represent a mean of duplicate assays. (B) Biogenesis of peroxisomal proteins. Cell lysates (≈1.8 × 10⁵ cells) were subjected to SDS/PAGE and transferred to polyvinylidene difluoride membrane. Cell types are indicated at the top. Immunoblotting was done with antibodies to acyl-CoA oxidase and thiolase. Arrowheads show the positions of acyl-CoA oxidase components, A, B and C; open and solid arrowheads indicate a larger precursor (P) and mature protein (M) of thiolase, respectively. Dots indicate nonspecific bands (14).

